Overview
Application Insights is an Azure offering that helps developers gain insight into their applications as far as exceptions, page views, response times..etc. However, one less known use case of Application Insights is the ability to track domain related events.
My team and I at Shift Digital work on Enterprise Lead Management Systems for automotive OEMs and other clients. Our systems accept leads from a variety of sources and delivers them to dealerships. We recently started using Application Insights to keep a close eye on what's happening within our systems. This helped us get better visibility on exceptions, response times, etc.. but we soon discovered how we can use the custom events feature of Application Insights to track domain-related telemetry.
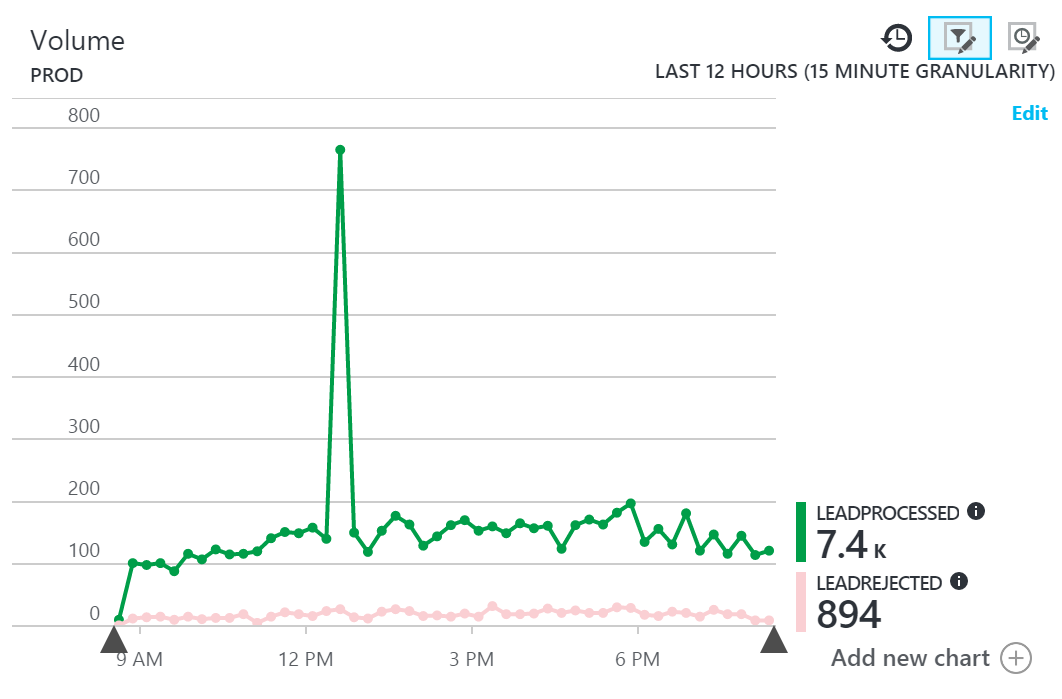
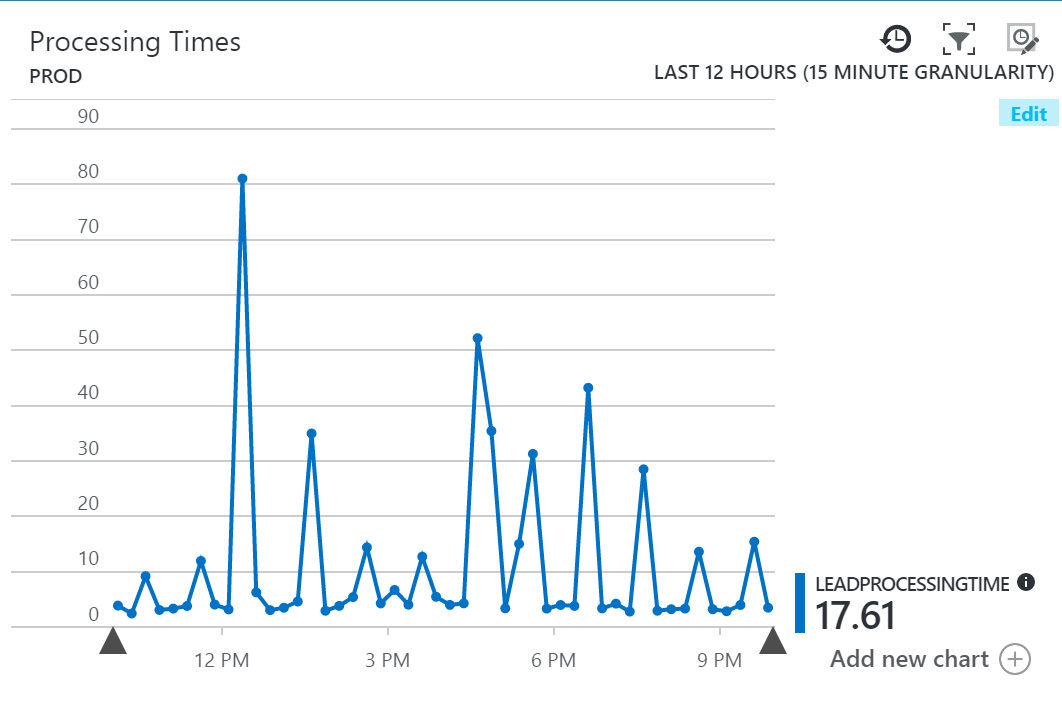
For example, we wanted to know the number of leads we are getting in real time. How many leads are accepted? How many are rejected? We never had that near real time insight into our application before. So with a few lines of code.. we were able to generate graphs like these:
The code
To make this possible, we simply track a custom event with properties and metrics as shown below:
Note: we first need to install the Microsoft.ApplicationInsights Nuget package
PM> Install-Package Microsoft.ApplicationInsights
//capture received time
var receivedTime = DateTime.Now();

//initialize telemetry client
var telemetryClient = new TelemetryClient();
telemetryClient.Context.InstrumentationKey = "your telemetry key";
telemetryClient.Context.Operation.Name = "LeadProcessing";

//do the actual work
...

//calculate how long it took to do the work
var processingTime = DateTime.Now.Subtract(receivedTime).TotalSeconds;

//track the event
var properties = new Dictionary<string, string>
{
   { "Source", "the source of the lead" }
};

var metrics = new Dictionary<string, double>
{
  { "LeadProcessingTime", processingTime }
};

telemetryClient.TrackEvent("LeadProcessed", properties, metrics);
The event being tracked here is "LeadProcessed". In addition to the event itself, we can also pass properties and metrics. Properties help when filtering and searching for events. For example, we are tracking the source of the lead so we can break leads by source when reporting on that event. On the other hand, metrics let us measure aspects related to the event. In our case, we are measuring how long it took us to process the lead. Both properties and metrics are optional.
Reporting on events
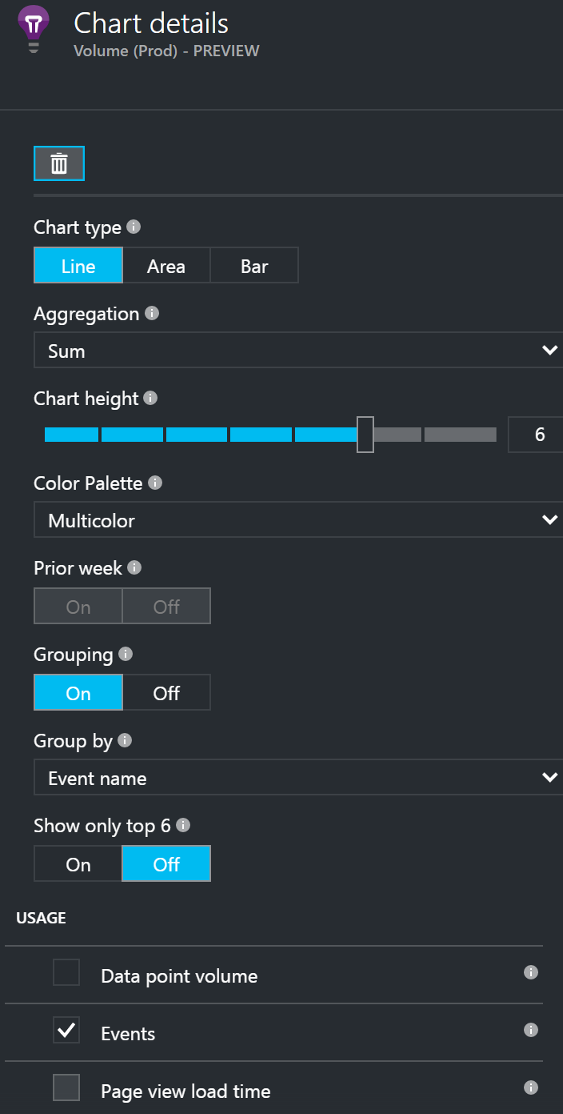
The easiest way I've found to generate these graphs is to pin an empty graph to an Azure dashboard, then customizing it. I turn grouping on by event name, then filter out any events I don't want.
Another way to report on these events is by using the Analytics feature of Application Insights where you can write custom queries to drill into the exact events we want to report on. For example, if we want a pie chart to visualize how many leads were processed versus rejected in the last day, we can write the following query:
customEvents
| where name == "LeadProcessed"  or  name == "LeadRejected" and timestamp <= ago(1d)
| render piechart
which gives us the following graph:
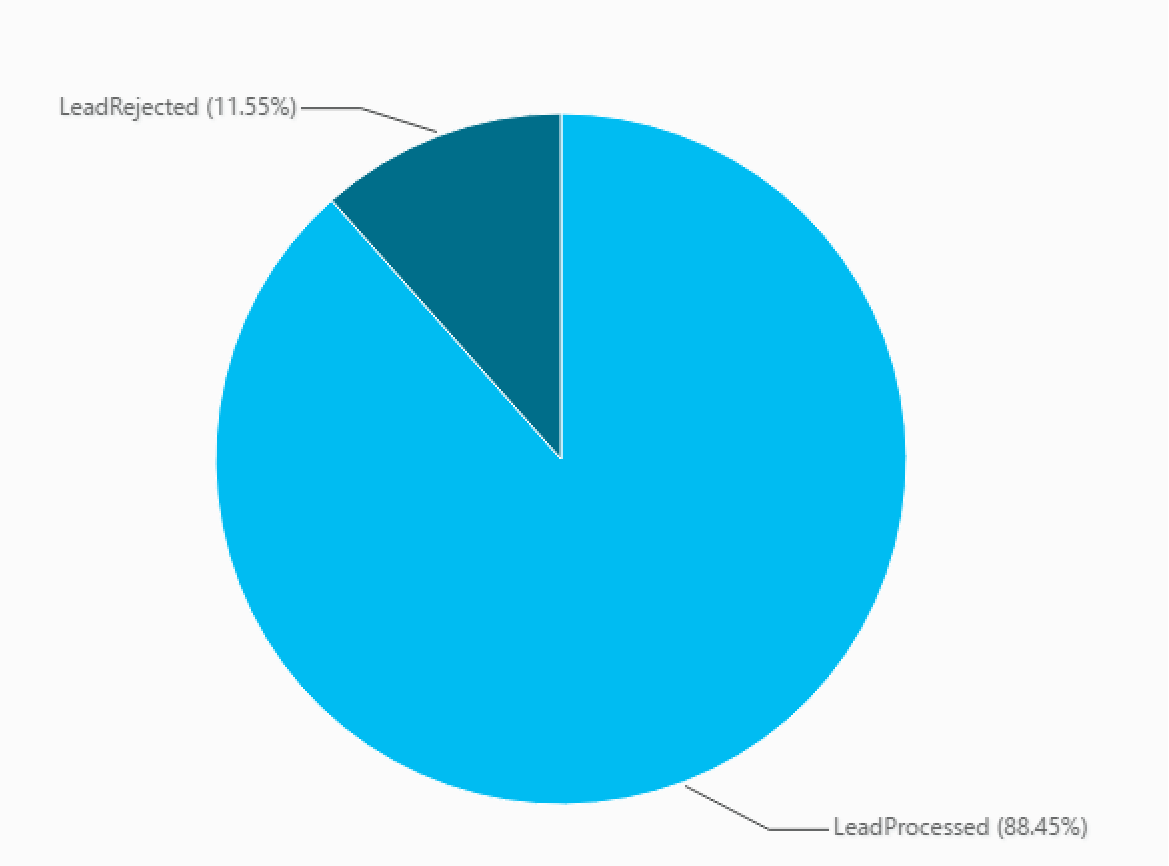
The Analytics tool uses a special query syntax that combines pipes, lots of helper methods, and intellisense to make querying data easier. These graphs can easily be pinned to an Azure dashboard which is nice.
Alerts for custom events with metrics
We can even set up alerts for metrics in our custom events. For example, if we want to be alerted when LeadProcessingTime exceeds a certain threshold, all we have to do is add an alert rule to the Application Insights resource like this:
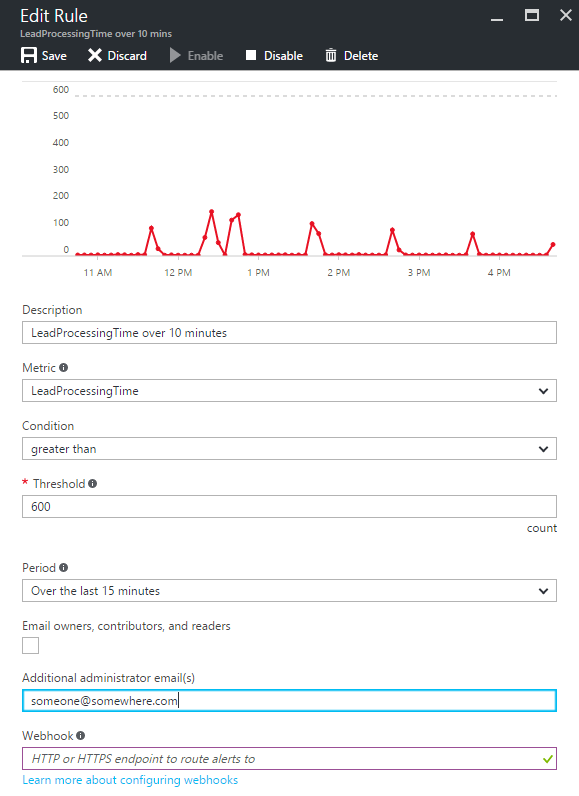
Now every time this metric exceeds our threshold for 15 minutes, we get an email alert. We can also specify a Webhook to be invoked if we want to forward this alert to Slack or HipChat for example. Neat!
Conclusion
Application Insights is a powerful tool that can help us get real-time insight into domain events happening within our application. We saw above how we were able to generate useful graphs with minimal effort and zero UI work. Using this tool will help us diagnose and prevent potential issues before they become problems.
Additional Resources
Azure documentation
Custom Events in more detail
Detailed walkthrough
Official GitHub Repository
Disclaimer: The data used to generate graphs in this post is test data for the purpose of demonstration only and does not reflect production values.